


Market Insights
SEF user has clear vue on the market changes through many dashboards.
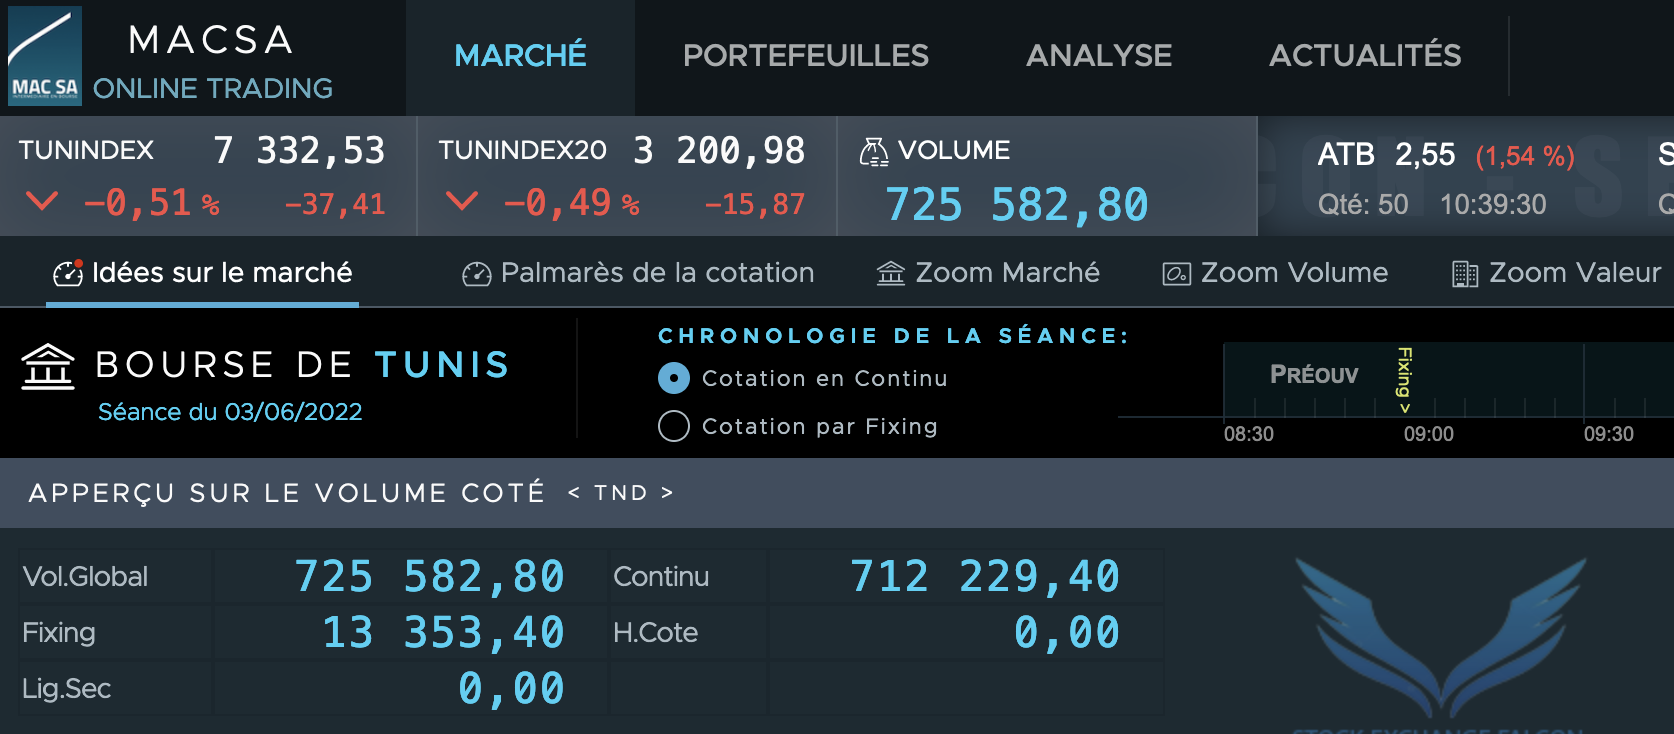
The main display provides realtime insights on the market main indices values and changes, the Trading volumes aggregated and per trading group values.
Market Indices
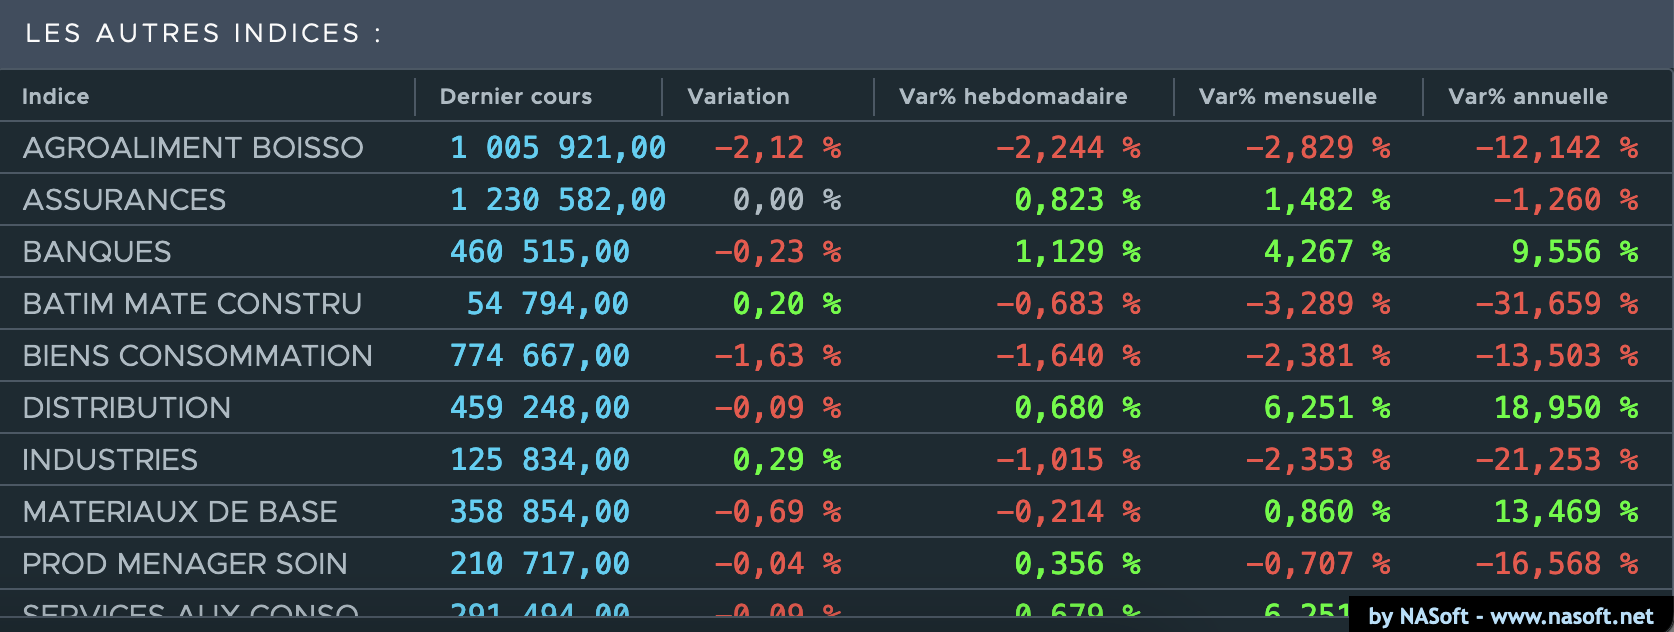
Besides the historical charts of the main market indices, SEF displays the realtime values of the sectorial indices and provides statistics on historical performances.
Market news
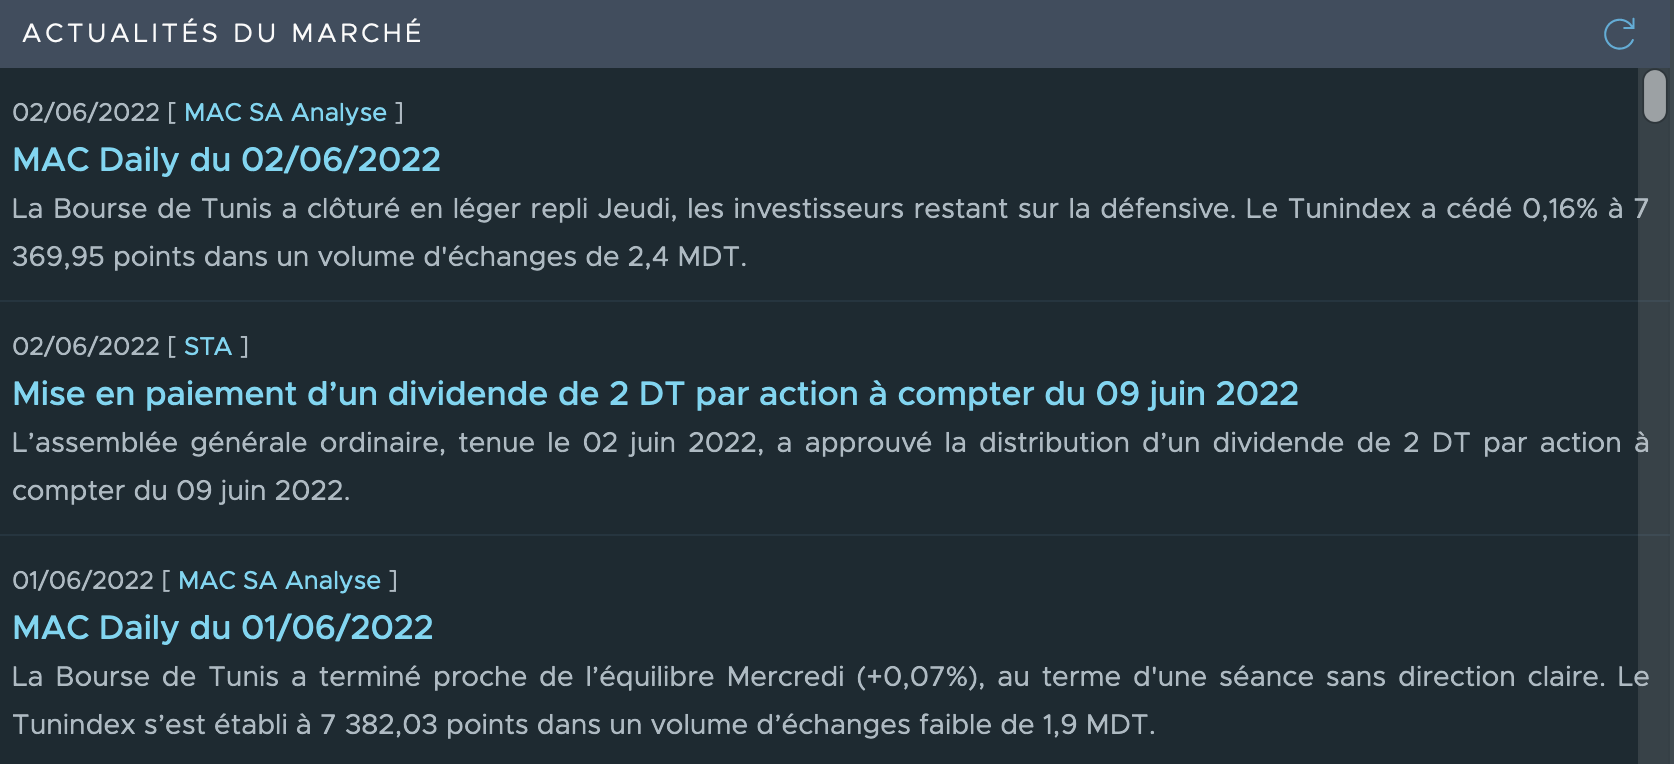
SEF keeps the online trading user connected to the market media. The news fetched from the broker web site are displayed in real time.
The user can click on each new to be redirected to the web site and get more details.
Market track records
Market track records are gathered in a "MARKET PALMARES" page.
The user has all the statistics on the current real time trading session: Advancers, Decliners, unchanged ...
Market indices charts are clearly displayed. Trades chart, is available to show the market main traded companies in a very easy way.
Market Zoom
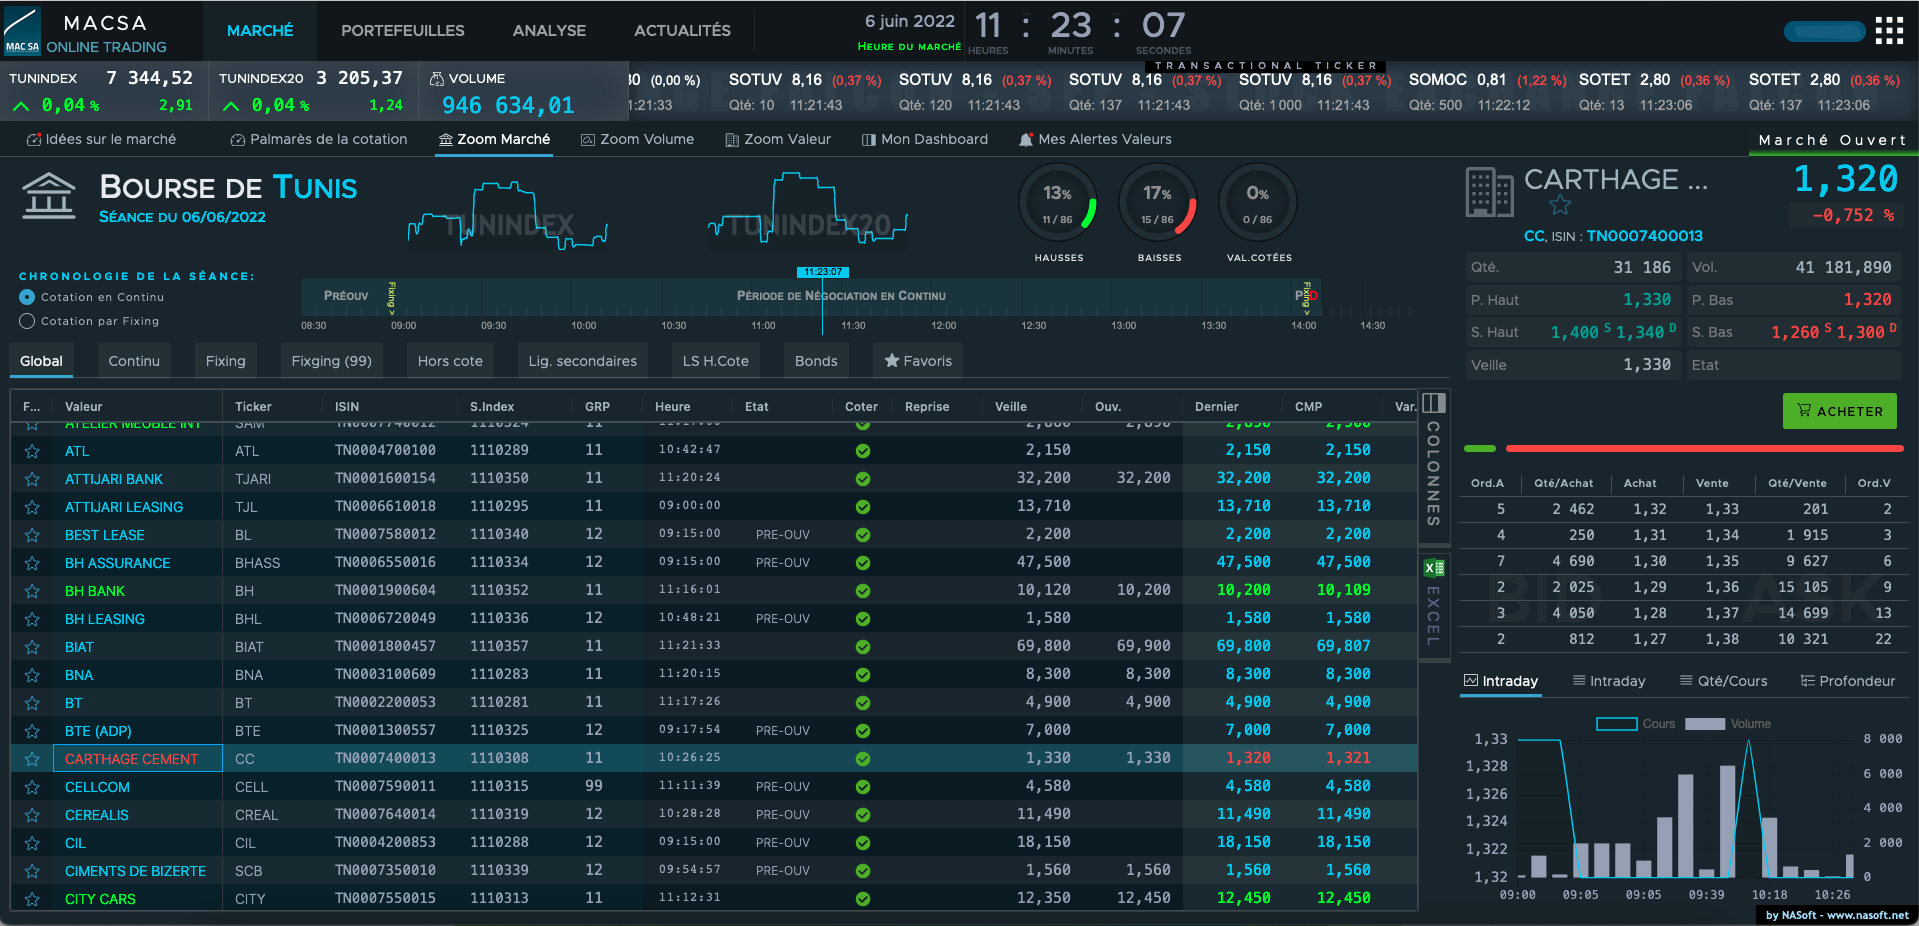
A realtime console displaying a summary of the trading session.
Each traded company figures in a line with all the trading data.
The changes can be very easily identified with the colors changes.
My Dashboard
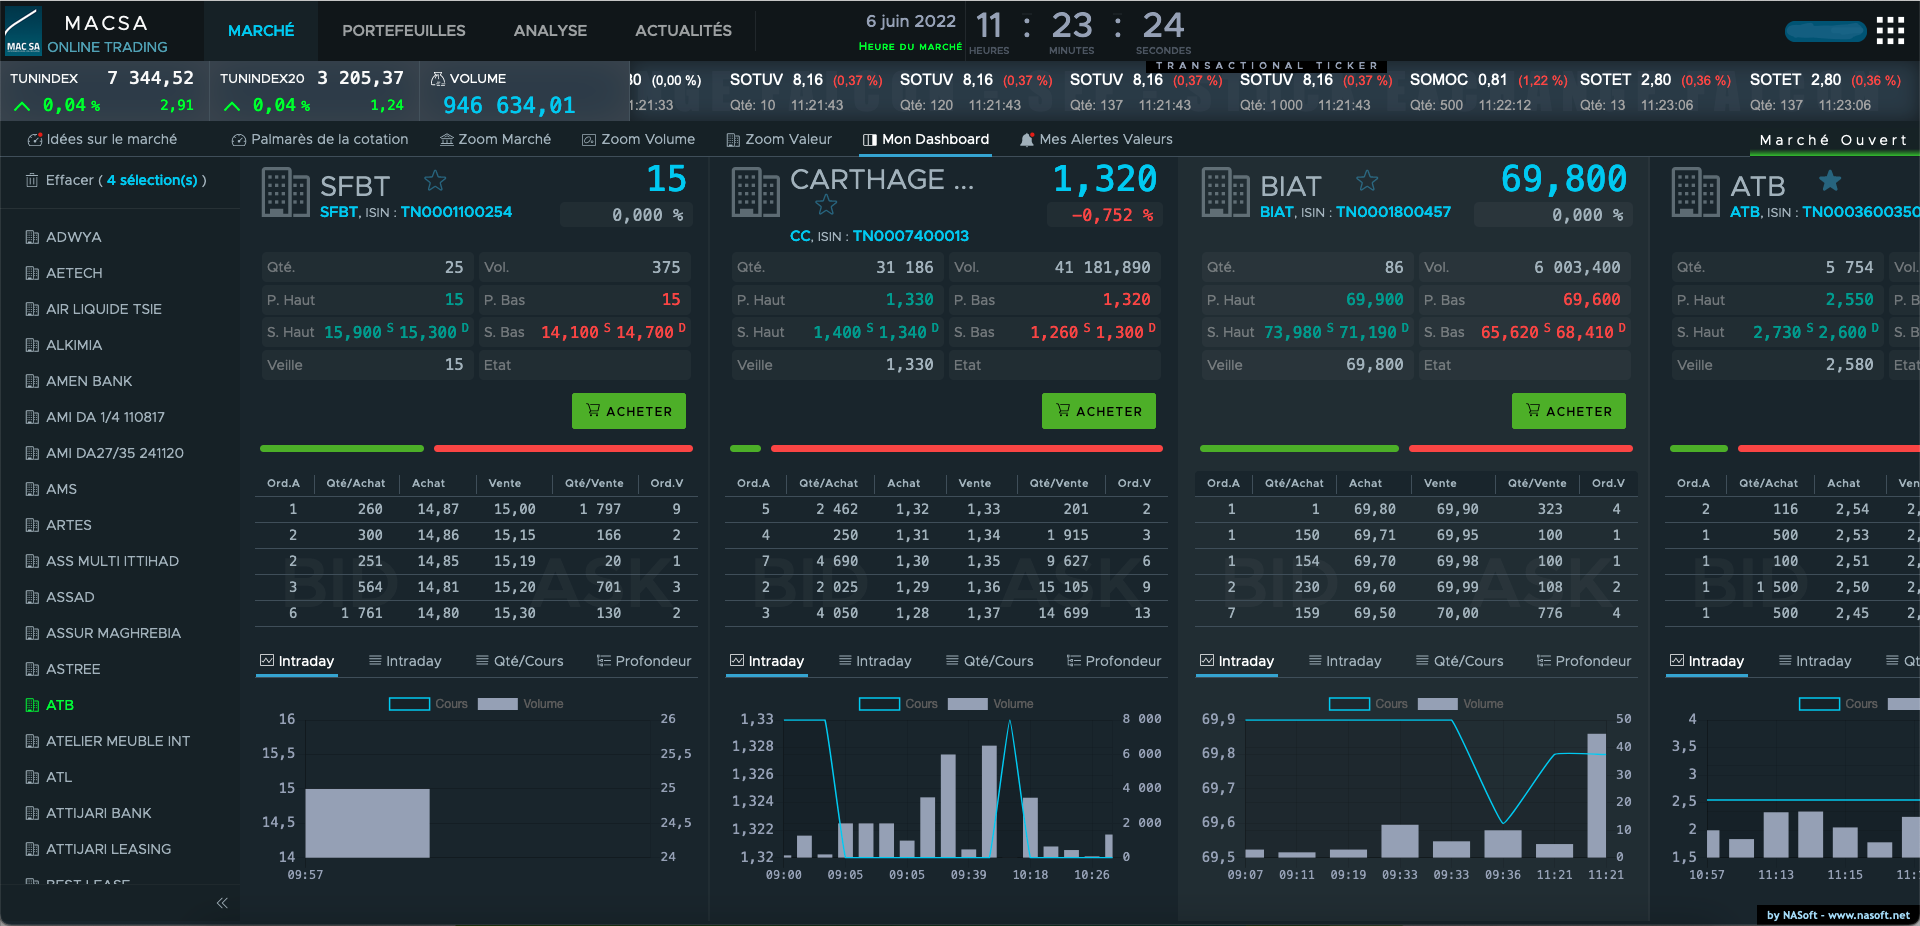
You can create your own dashboard with the desired equities.
You keep a close focus on the equities you interested in.
Your choices are persistant.
Portfolios Management
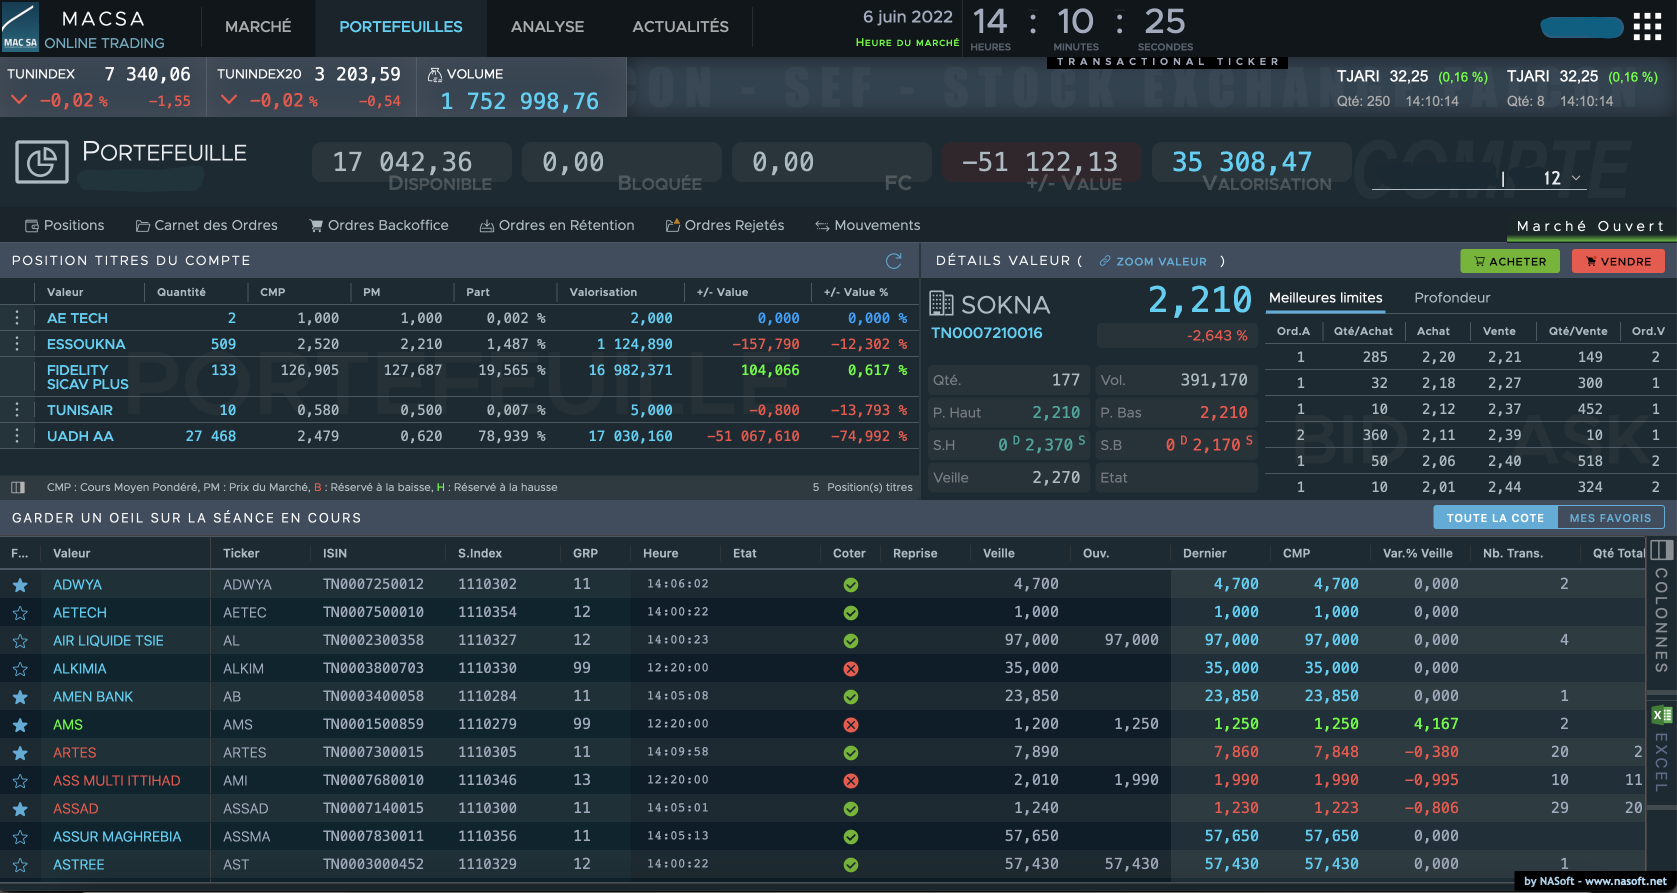
A full management space for your portfolios.
You can at any time, check your positions in stocks and in cash.
You can follow your operations : cash and stocks.
Orders Processing
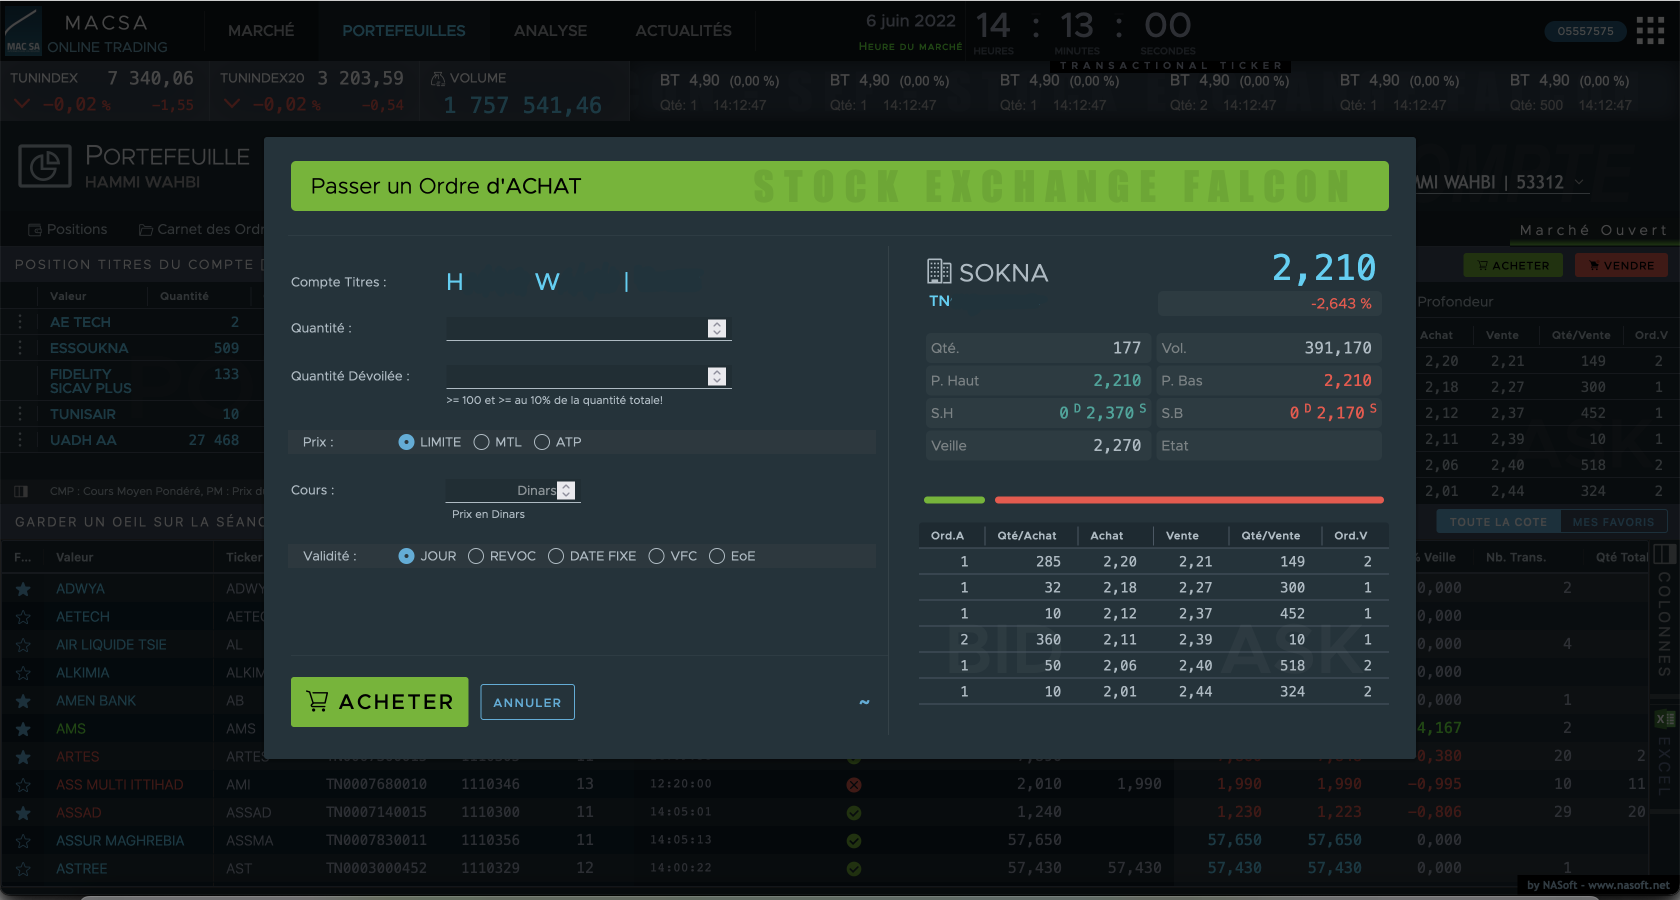
You can send orders at any time.
Orders dialog can be raised from anywhere in the SEF web application.
Analytics Dashboard
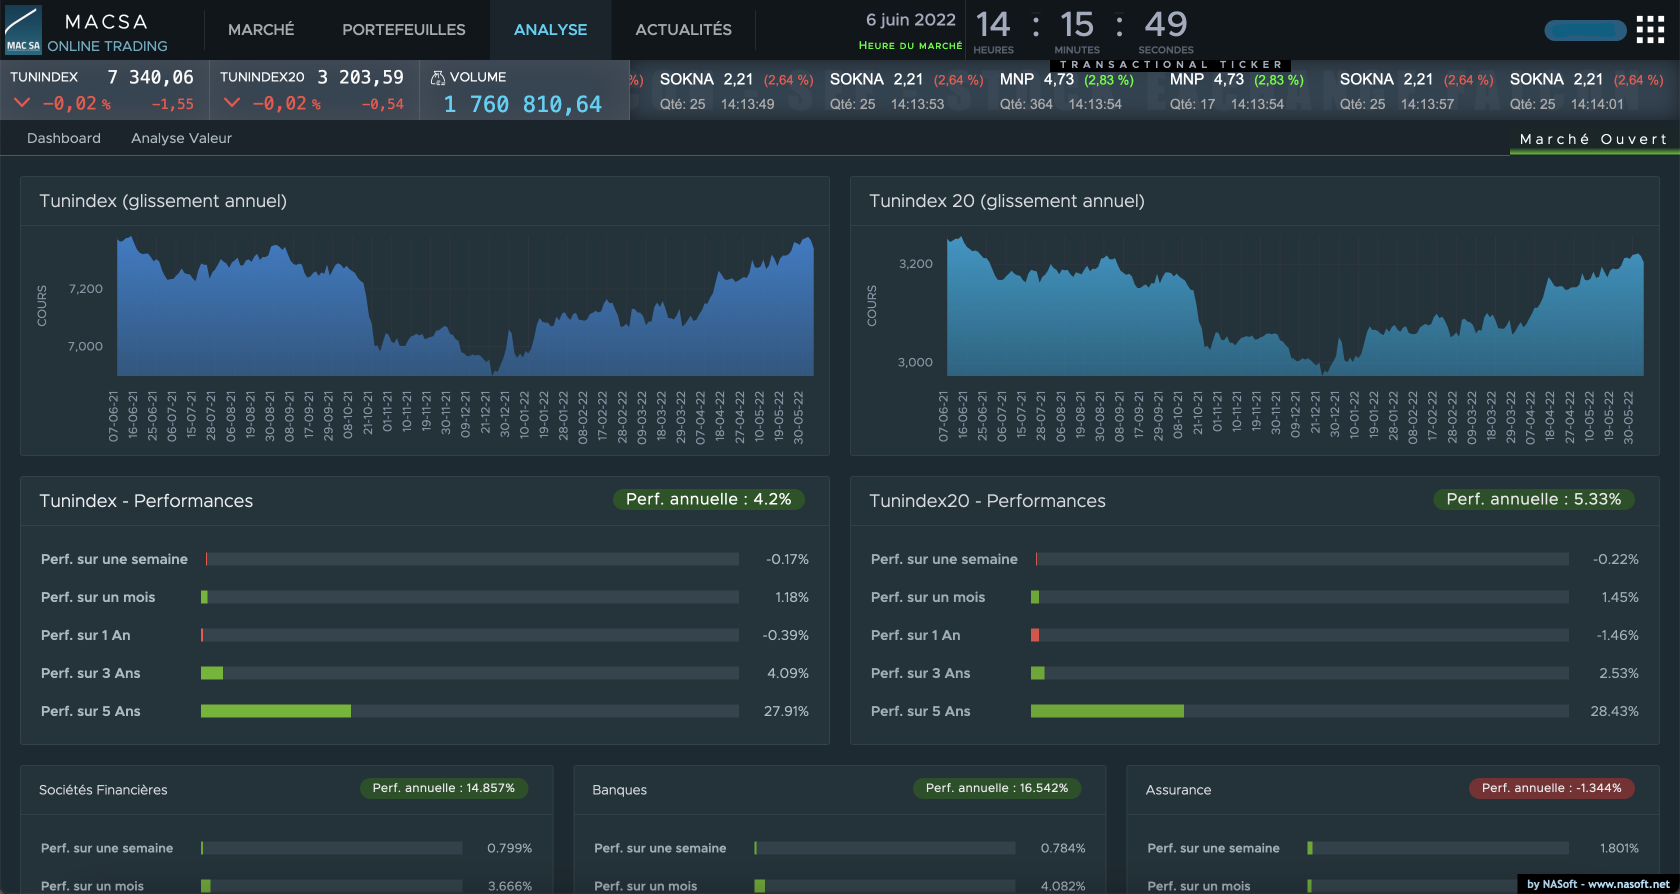
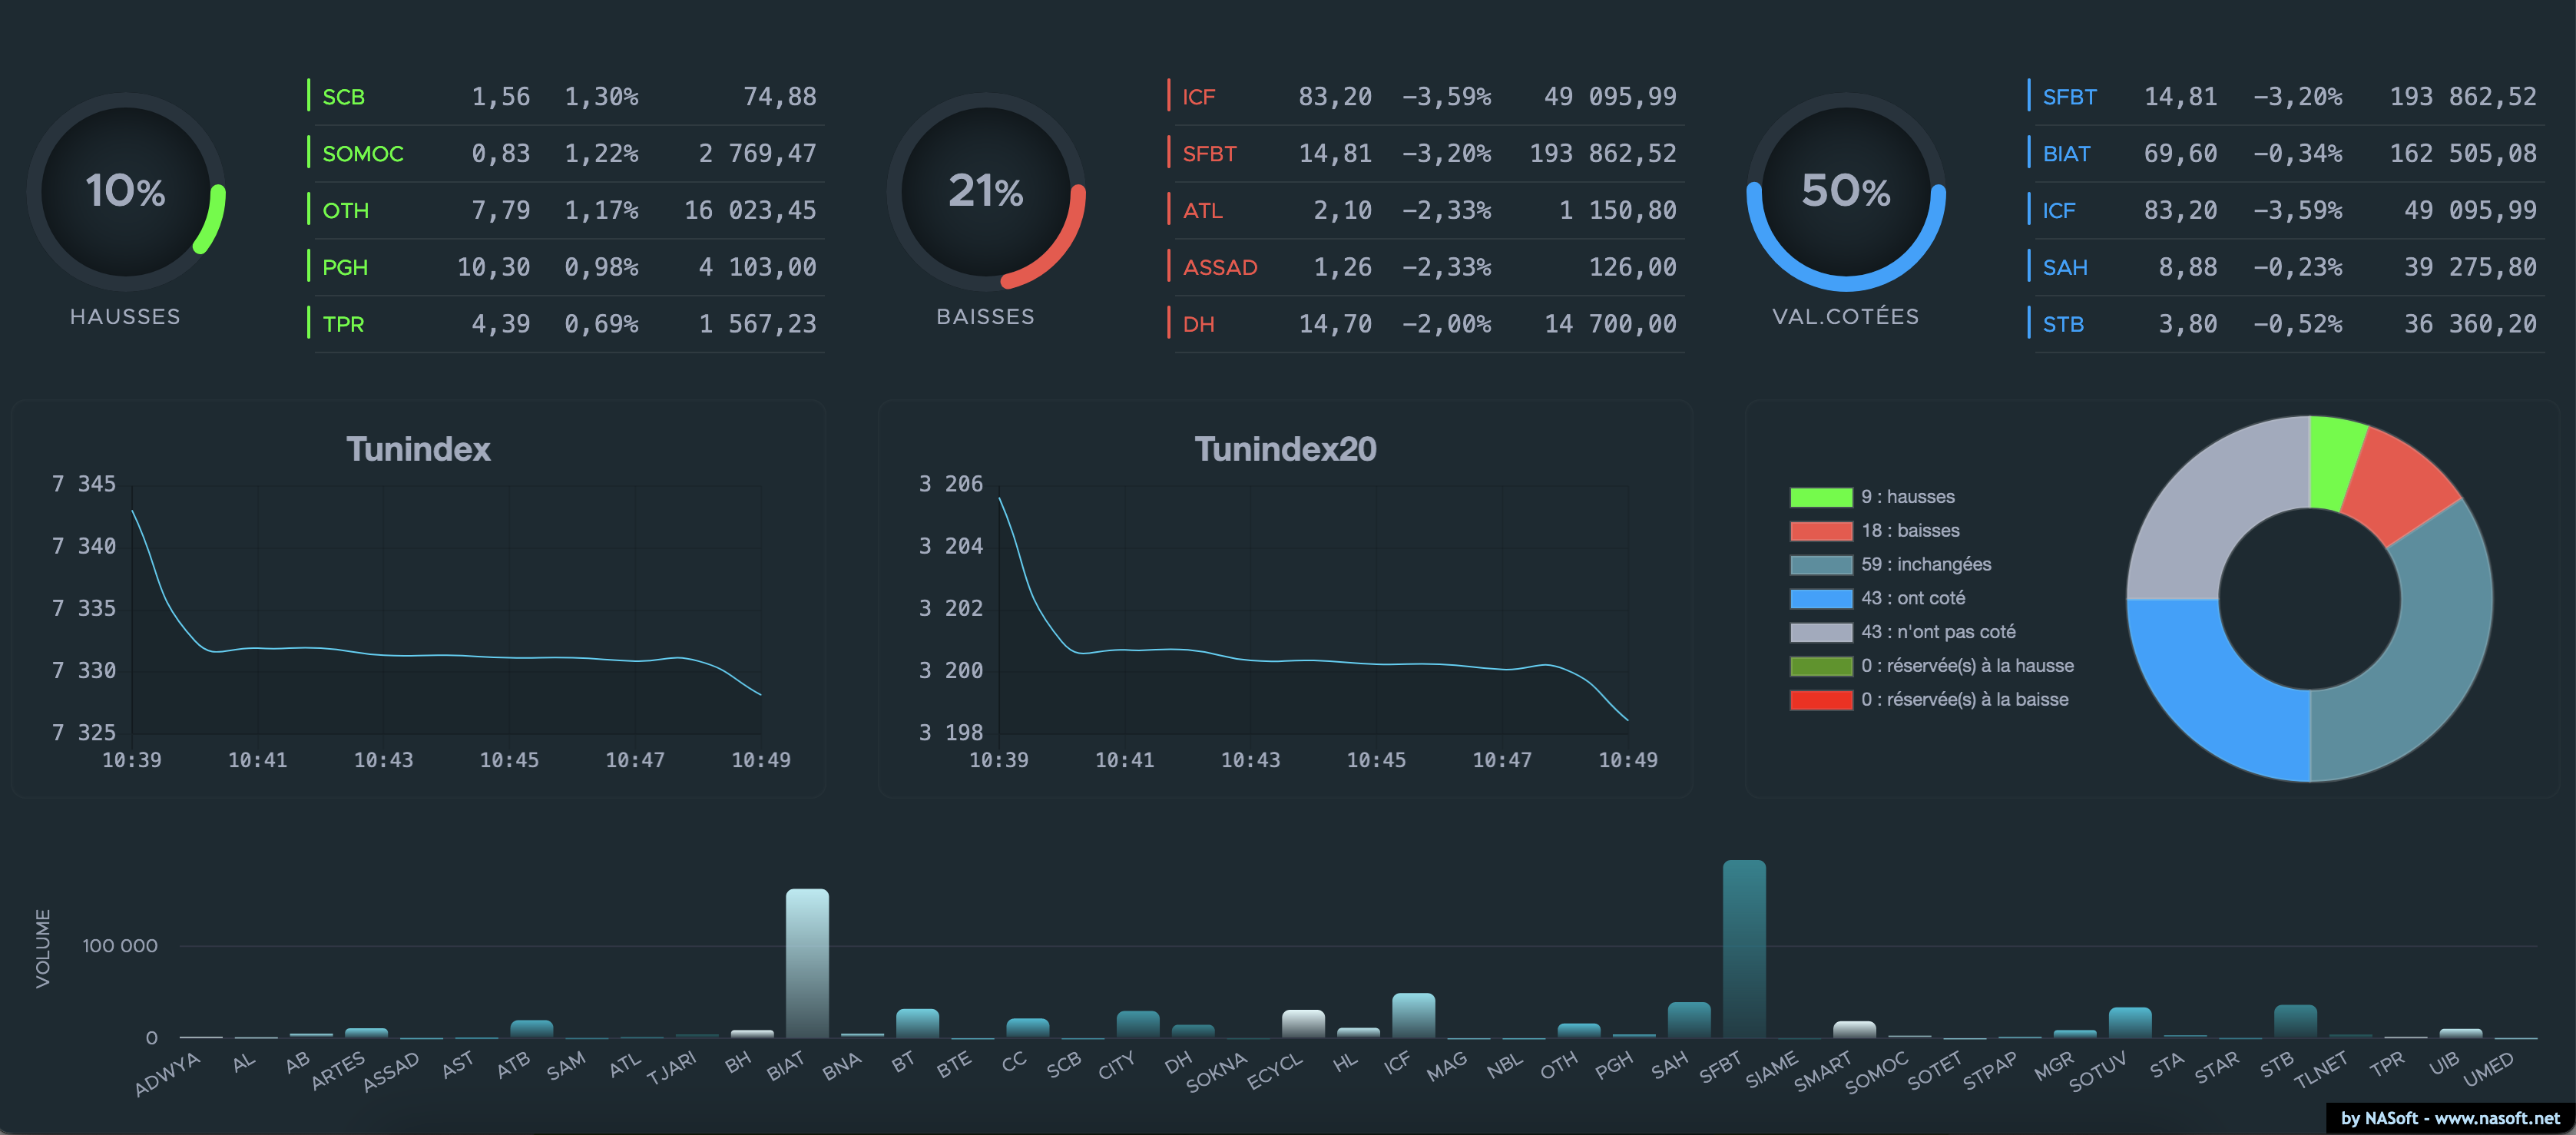
An analytics zone is there to synthesise a number of KPIs about the indices and about the different traded equities.
You can choose the equity to display its statistics through a select list on top.